

.png)
Your agent just failed in production. A customer got a wrong answer. A tool call went sideways. Now you're combing through logs, piecing together what happened across multiple services, and hoping you can reproduce the issue before it happens again.
This is the reality for most teams running agentic systems today.
Tracing, the ability to see exactly what your agent did step by step, is essential. But for too many teams, getting that visibility still means shipping sensitive data to a third-party platform.
For enterprises handling sensitive data, that is a non-starter.
That's exactly why we built Native Tracing into Agno: end-to-end observability for your agents, directly in the platform, with trace data that never leaves your infrastructure.
The problem with third-party tracing
Most teams building with agents eventually bolt on an external observability tool. While these platforms provide useful tracing capabilities, they introduce a fundamental tradeoff: your prompts, model outputs, tool calls, and even intermediate reasoning steps all flow through someone else's servers.
For enterprises, especially those in regulated industries, this creates real friction. Sensitive prompts and outputs crossing organizational boundaries raises compliance questions. Security teams push back. Legal reviews slow things down. Developers end up either fighting for approval or, worse, flying blind without tracing at all.
Even for teams without strict compliance requirements, the workflow is clunky. You are context switching between your agent platform and a separate tracing dashboard, manually correlating data, and dealing with the latency of exporting and re-importing trace information.
What native tracing does
Native Tracing captures the full lifecycle of an agent run—every step, every decision, every tool call—and stores it directly in your own database. There's no external dependency and no data leaving your environment.
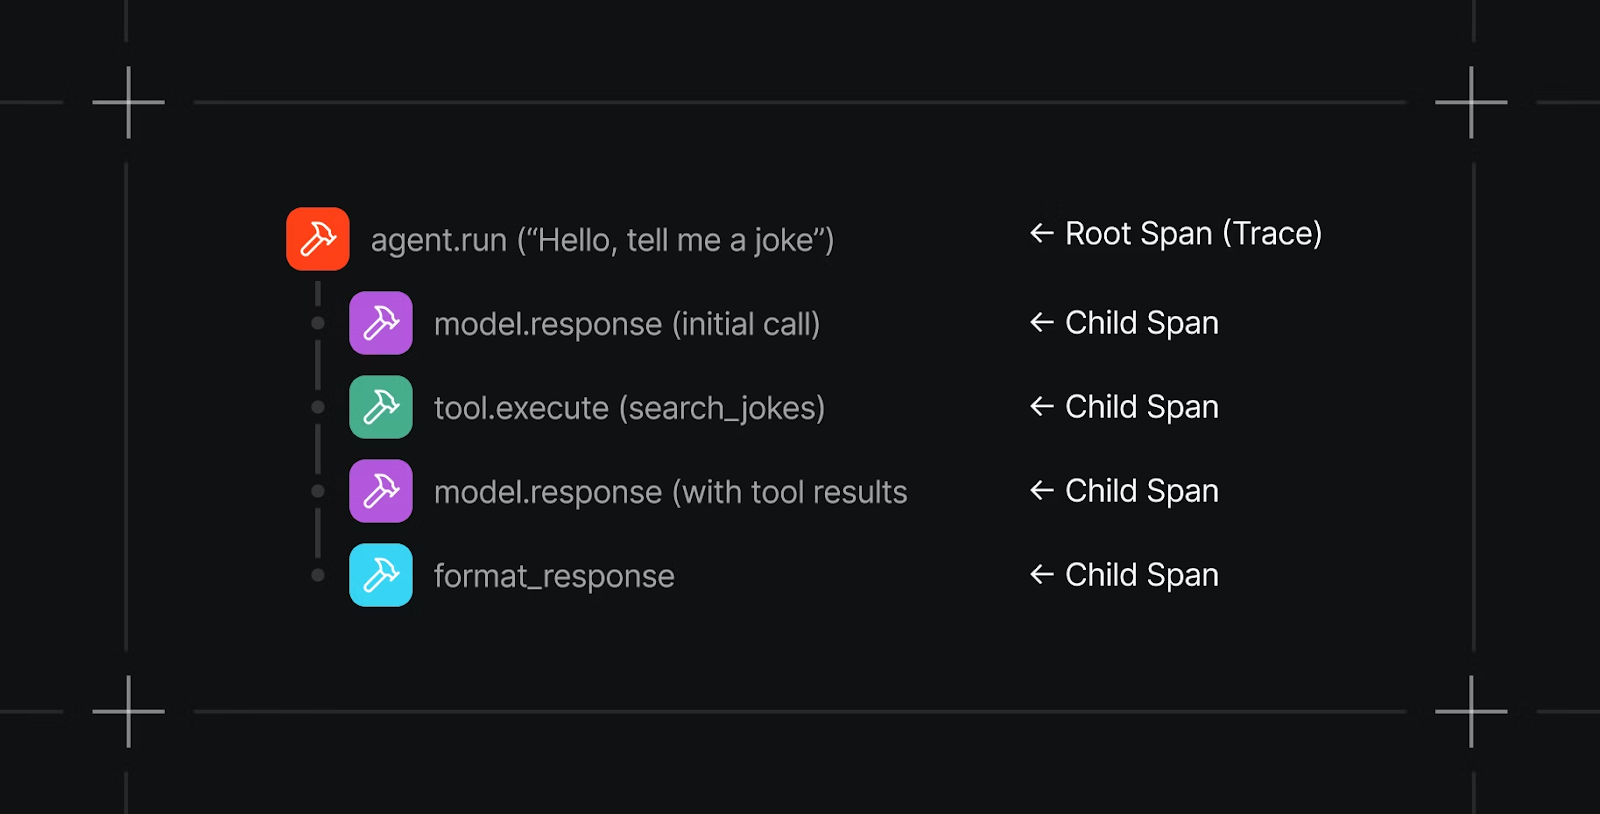
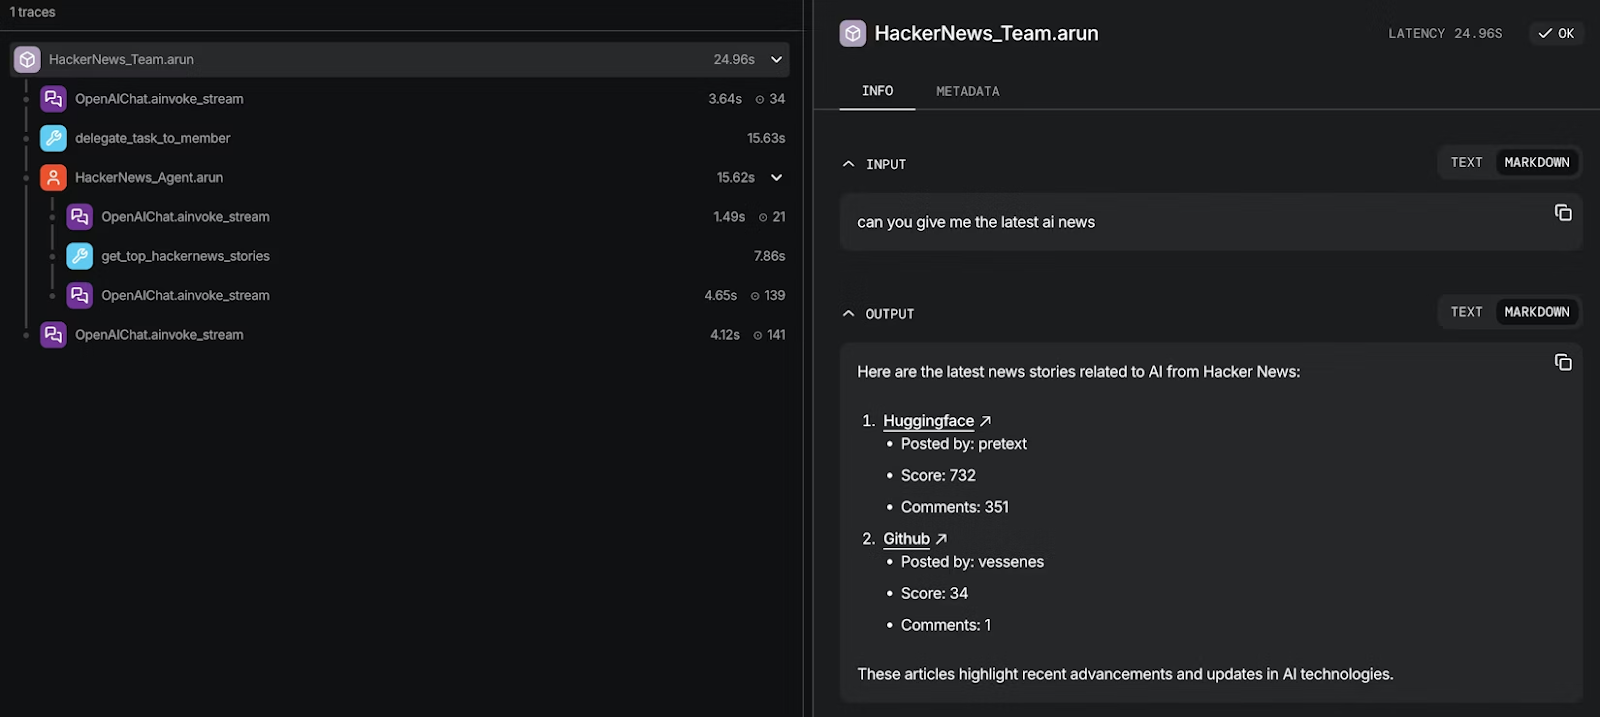
When you expand a trace, you see a granular, step-by-step breakdown of the entire workflow. Each step shows its inputs, outputs, timing, and any errors that occurred. If something went wrong, you do not have to guess where it happened. Instead, you can pinpoint the exact step that failed and inspect exactly what the agent saw and produced at that moment.
This isn't just a log dump. It's structured observability designed for the way agents actually work: multi-step, tool-using, and often non-deterministic.
Why native tracing matters
Your data stays yours. Trace data—including prompts, completions, and intermediate reasoning—is stored in your own infrastructure. No third-party vendor ever sees it. For enterprises with security and compliance requirements, this removes an entire category of risk.
Faster debugging. When an agent misbehaves, you need to understand why quickly. Native Tracing lets you drill into any run and follow the agent's reasoning step by step, all from the same platform where you built and deployed the agent. No context-switching, no data exports, no correlation headaches.
Production-grade observability. This isn't just for development. Native Tracing is built for production workloads, giving you the visibility you need to monitor agent behavior at scale, catch regressions early, and build confidence in your agentic systems over time.
Better results through tighter iteration. Because tracing lives inside the same platform where you build and deploy, the loop from "something went wrong" to "here's the fix" gets dramatically shorter. You spot the failure, inspect the step, adjust your agent, and validate—all without leaving Agno. That speed compounds over time into more reliable agents and fewer production incidents.
Getting started with Agno’s native tracing
Setup takes just a few lines. Install the OpenTelemetry package:
pip install -U opentelemetry-sdk openinference-instrumentation-agno
From there, you have two paths depending on your deployment:
For standalone scripts and notebooks, use setup_tracing() for full control over configuration, including batch processing, queue sizes, export delays, and more.
For AgentOS deployments, simply set tracing=True. That's it. Sensible defaults handle the rest.
Either way, once tracing is enabled, every agent run is automatically captured with full step-level detail.
If you're building agents and need observability you can trust, check out the tracing docs and get started.